Count per Area
A tree total for every area of interest, built on your own boundaries.

Skeye finds tree crowns in satellite imagery and gives you a tree count for each of your areas of interest. No clicker counts, no walking the rows and no GIS expertise needed.
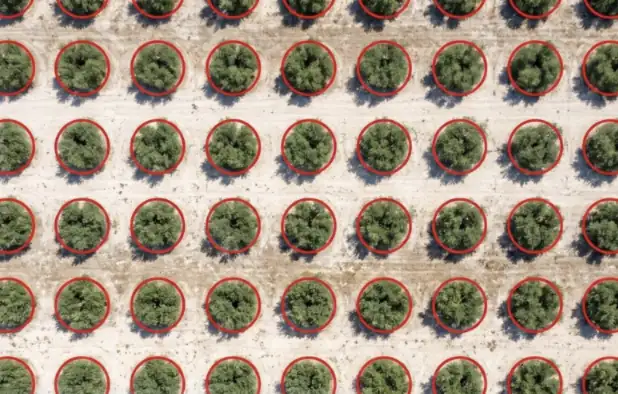
Tree counting uses AI to pick out individual tree crowns in a satellite image, outline each one and add them up per area of interest.
You choose a map and draw the area you care about. Skeye detects the crowns across that area, then assigns each tree to the area of interest that holds its centre. A tree that sits on a boundary is counted once, not twice.
Because the count is stored with the capture date, you can come back next season, run it again and see where trees have been added or lost.
Each run gives you numbers you can act on and the map to back them up.
A tree total for every area of interest, built on your own boundaries.
See every detected crown on the map, so you can check the count against the image yourself.
Trees on a shared boundary go to one area only, so totals add up across your land.
Every run is kept by capture date. Follow an area over time and spot losses early.
Put the tree count next to vegetation health and bare soil for the same area and date.
Start a count and carry on working. We notify you in the app, and by email if you like, when it is done.
Use your own satellite imagery or pick a capture from the Skeye image library.
Mark the area to analyse. Skeye matches it to the areas of interest it covers.
Tree crowns are detected across the area and assigned to each area while you get on with other work.
Open the counts and crown outlines, then compare them with earlier runs on the same areas.
Anywhere you need to know how many trees stand on a piece of land, and whether that number is changing.
Keep an up-to-date inventory per block and find gaps to replant without counting tree by tree.
Check tree crops area by area and see how numbers hold up from one season to the next.
Follow tree cover across a region and spot areas where trees have been removed.
Track trees in parks, streets and green spaces as neighbourhoods are built up.
Record trees around a site before works begin and follow replanting afterwards.
Show how tree planting on a farm or programme is progressing, area by area and date by date.
Trees absorb carbon dioxide as they grow and store it in their wood, roots and leaves. Any estimate of that absorption starts with knowing how many trees there are and where they stand.
How much carbon your land takes in depends on how many trees it holds. A reliable count per area is the first input for any absorption estimate.
Give your carbon accounts a tree inventory with a date on it. Every count is stored by capture date and can be traced back to the image it came from.
Show how tree numbers in each area changed between reporting periods, including where trees were removed and where new planting took hold.
Skeye counts trees and records how that count changes over time. It does not calculate carbon figures or certify credits. Your carbon specialist or chosen methodology turns the counts into estimates.
No. You choose a map, draw an area and Skeye does the rest. Results appear on the map and as counts per area of interest.
Yes. Analyse imagery you already have, or use captures from the Skeye image library.
Each tree is assigned to the area that contains the centre of its crown, so it is counted once and totals stay consistent across neighbouring areas.
Yes. Every detected crown is outlined on the map, so you can compare the result with the image and question anything that looks off.
Yes. Each run is stored with its capture date. Run a new count on a later image and compare it with earlier results for the same areas.
It depends on the size of the area. Counts run in the background and we notify you when results are ready, with an optional email.
No. Skeye gives you tree counts per area of interest and how they change over time. Those counts can feed your carbon accounting, but converting them into carbon figures is done with your own methodology or specialist.
Your organisation works in its own private space. Every analysis is recorded in an activity trail so your team knows who ran what and when.
Tell us about your land and we will show you tree counts for your own areas of interest.